Classifying nano particles with deep learning
Using Brownian motion to infer particle shape
Introduction
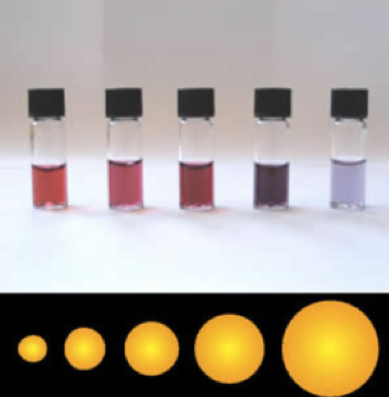
Gold and Silver nano particles have many useful applications. The first I dealt with them, I was doing an assignment for a nano-science based bio tech company.
That company was using nano particles to detect diseases like viruses and bacteria, with called Surface Enhanced Raman Spectroscopy (SERS).
Surface Enhanced Raman Spectroscopy
Raman spectroscopy is a technique from analytical chemistry, known to be very selective when it comes to molecular composition.
Typical applications of Raman spectroscopy include cocaine detection. Like many molecules, cocaine produces a characteristic spike that is visible on the spectrogram.
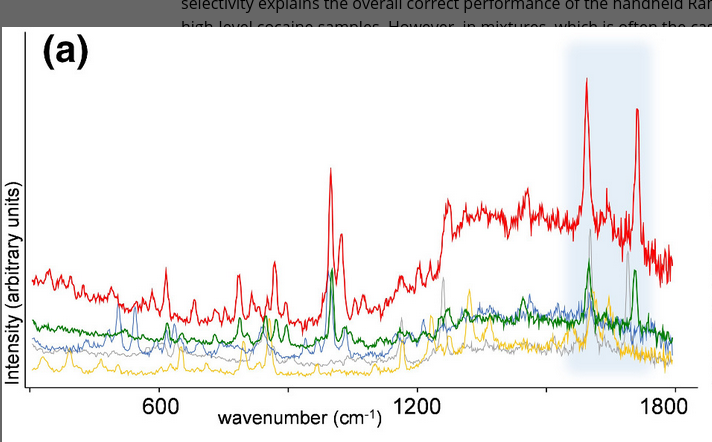
Ordinary Raman spectroscopy could be used to detect bacteria, in principle. In practise the concentrations of the associated molecules are so low, the signals overshadowed by other effects.
This is where SERS and the nano particles come in. When struck with light of certain frequencies, nanoparticles can induce a plasmon resonance. This resonance can give rise to a strong magnification (1000–100 000x) of parts of the Raman spectrum.
Several academic papers describe how they used Surface Enhanced Raman Spectroscopy to distinguish bacterial species from colonies grown on a Petri dish. The nature of SERS enhancement depends however on the characteristics of the nano particles than are being used.
Quality control of nano particles
The spectrum obtained through SERS is highly sensitive to the characteristics of the nano particles, like shape and size. It is known that nanoparticle shape has a strong influence on optical properties such as plasmon resonance and Raman enhancement.
It is crucial to monitor and control the monitor the properties of the nano particles being used in experiments and products.
This is however easier said than down however. You can’t take pick up a few nano particles with a pair of tweezers and place them under the microscope. It is very challenging to perform direct measurements on the shape and size of nano particles directly.
Nano Tracking Analysis
It is way easier to infer the properties of nano particles in an indirect ways.
One way suspending nano particles in a liquid and track them while they perform a random walk. This method, called Nano Tracking Analysis (NTA) (Dragovic et al. 2011) (Gross et al. 2016), can reveal details like the size of a nano particles. The shape of the particles remains inaccessible.
Nano Tracking Analysis with Deep Learning
In a recent paper Hiroaki Fukuda, Hiromi Kuramochi, Yasushi Shibuta, Takanori Ichik (Fukuda et al. 2023) outline a method based on deep learning to distinguish between rod and spherical shaped gold nano particles.
The authors motivate this approach noticing that the random walk of the particles is not only effected by the size of the particle, but also by it’s shape. (Hanasaki and Isono 2012)
Experimental setup
The experimenters used two commercially available types of gold nanoparticles: spherically shaped AuNA (Citrate capping, 80 nm diameter, Sigma-Aldrich) and rod shaped AuNR (Citrate capping, 40 nm diameter × 180 nm length, Nanopartz).
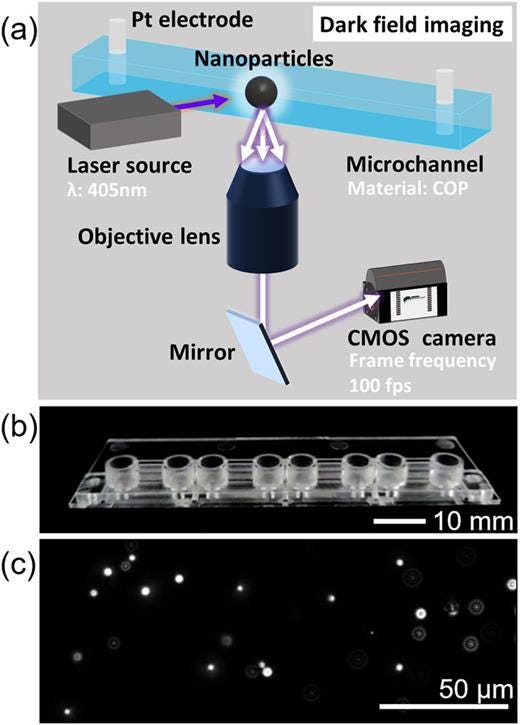
The experimental setup is as follows:
- The nano particles go into a microfluidic channel and are irradiated with a laser from the side of the channel.
- The scattered light is focused by an objective lens below the channel
- The focused bundle of light goes into the retina of a high sensitivity camera that captures 100 frames per second.See fig. 3 for an overview of the setup.
Processing
The particles are tracked and their location is recorded; see fig. 4
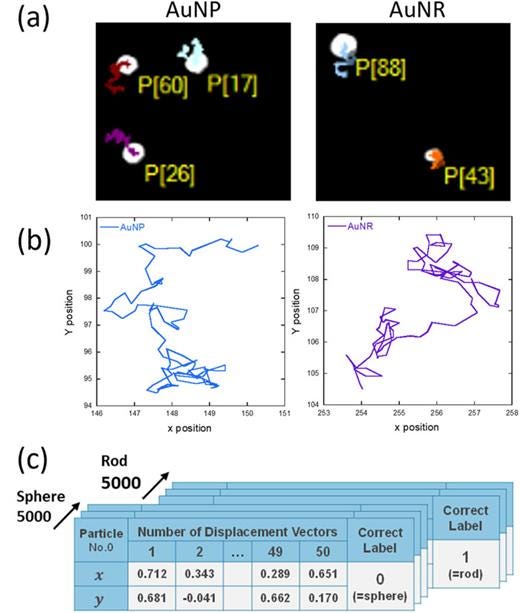
In this way the authors obtained a dataset with trajectories of 5000 AuNP and 5000 AuNR particles with 100 time steps of 10 ms.
The authors trained several discriminative deep learning models to classify the trajectories as belonging to either AuNP (sphere) or AuNR (rod).
Results
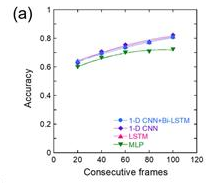
The most successful model was an LSTM model feeding on 100 frames. This model achieved an accuracy of 80%.
The accuracy keeps increasing with the number of frames (fig. 5), indicating that some progress could be made there by adding more frames or by working with a faster camera.
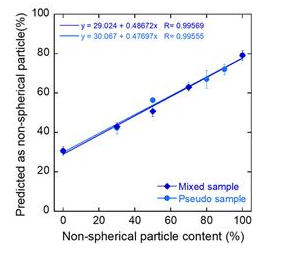
The model performs considerably better on macroscopic level. Tasked to predict the ratio of rods vs spherical particles in a mixture, error levels range from 0.3% and 5.2%; depending on ratio between sphere- and rod-shaped particles. The correlation plot in fig. 6 reflects this.
Conclusion
The Brownian motion of nano particles is affected by particle shape. Even at time scales as large as 10 ms, a deep learning classifier can can discern spherical particles from rod shaped particles with some precision at the single particle level. When it comes to establishing the relative proportion of the shapes of particles the errors are considerably lower, ranging from 0.3% to 5.2%, depending on the ratio.
A limitation to this work is that a trained classifier can be used only for the particles it is trained on. In applications like quality control, it is not known ab initio what sort or particles may be observed in a system. For example when trying to detect contamination.
This method can used directly to measure concentrations of nano particles that are profiled in advanced.
References
Dragovic et al. 2011.
Fukuda, Hiroaki, Hiromi Kuramochi, Yasushi Shibuta, and Takanori Ichiki. 2023. “Analysis of Brownian Motion Trajectories of Non-Spherical Nanoparticles Using Deep Learning.” APL Machine Learning 1 (4): 046104. https://doi.org/10.1063/5.0160979.
Gross et al. 2016.
Hanasaki, Itsuo, and Yoshitada Isono. 2012. “Detection of Diffusion Anisotropy Due to Particle Asymmetry from Single-Particle Tracking of Brownian Motion by the Large-Deviation Principle.” Physical Review E 85 (5): 051134. https://doi.org/10.1103/PhysRevE.85.051134.
Kranenburg, Ruben F., Joshka Verduin, Renee de Ridder, Yannick Weesepoel, Martin Alewijn, Marcel Heerschop, Peter H. J. Keizers, Annette van Esch, and Arian C. van Asten. 2021. “Performance Evaluation of Handheld Raman Spectroscopy for Cocaine Detection in Forensic Case Samples.” Drug Testing and Analysis 13 (5): 1054–67. https://doi.org/10.1002/dta.2993.
Working on a simulation or measurement pipeline that is too slow to iterate on? Book Free Consultation.